
Days Inventory Outstanding (DIO) is a liquidity metric that measures the average number of days a company takes to sell its inventory.
Efficient inventory management is an important part of the success of any business. One key metric that helps in evaluating how well a company manages its inventory is Days Inventory Outstanding (DIO). DIO measures the average number of days a company holds its inventory before selling it. Understanding and managing DIO can provide valuable insights into a company’s operational efficiency and its impact on cash flow.
Poor management of DIO can result in excess inventory, higher storage costs, and potential losses due to unsold or outdated products. A well-managed DIO can lead to improved cash flow, reduced storage costs, and minimised risk of inventory obsolescence.
DIO is also important part of the Cash Conversion Cycle (CCC), and along with days payable outstanding (DPO) and days sales outstanding (DSO), it helps a company measure the speed with which it converts its inventory investment into capital.
DIO explained
DIO is a financial indicator that calculates how long it typically takes a business to sell all of its inventory over a given time frame. It is a crucial sign of how well a business handles its inventory. As we mentioned, a reduced DIO indicates effective inventory management and high sales performance since it shows that a corporation can turn its inventory into sales quickly. On the other hand, a larger DIO indicates that merchandise is lying on the shelf for longer than it should be, which may be a sign of overstocking, sluggish sales, or problems with demand projections.
Maintaining a healthy cash flow is dependent on effective DIO management because protracted inventory holding periods can tie up large sums of capital. Businesses can see possible issues with their inventory management procedures and take corrective action to optimise stock levels and boost overall operational efficiency by monitoring DIO. Gaining an understanding of DIO also makes it easier to assess a company’s competitiveness in the market by comparing its performance to industry benchmarks.
DIO formula
The formula for calculating DIO is:
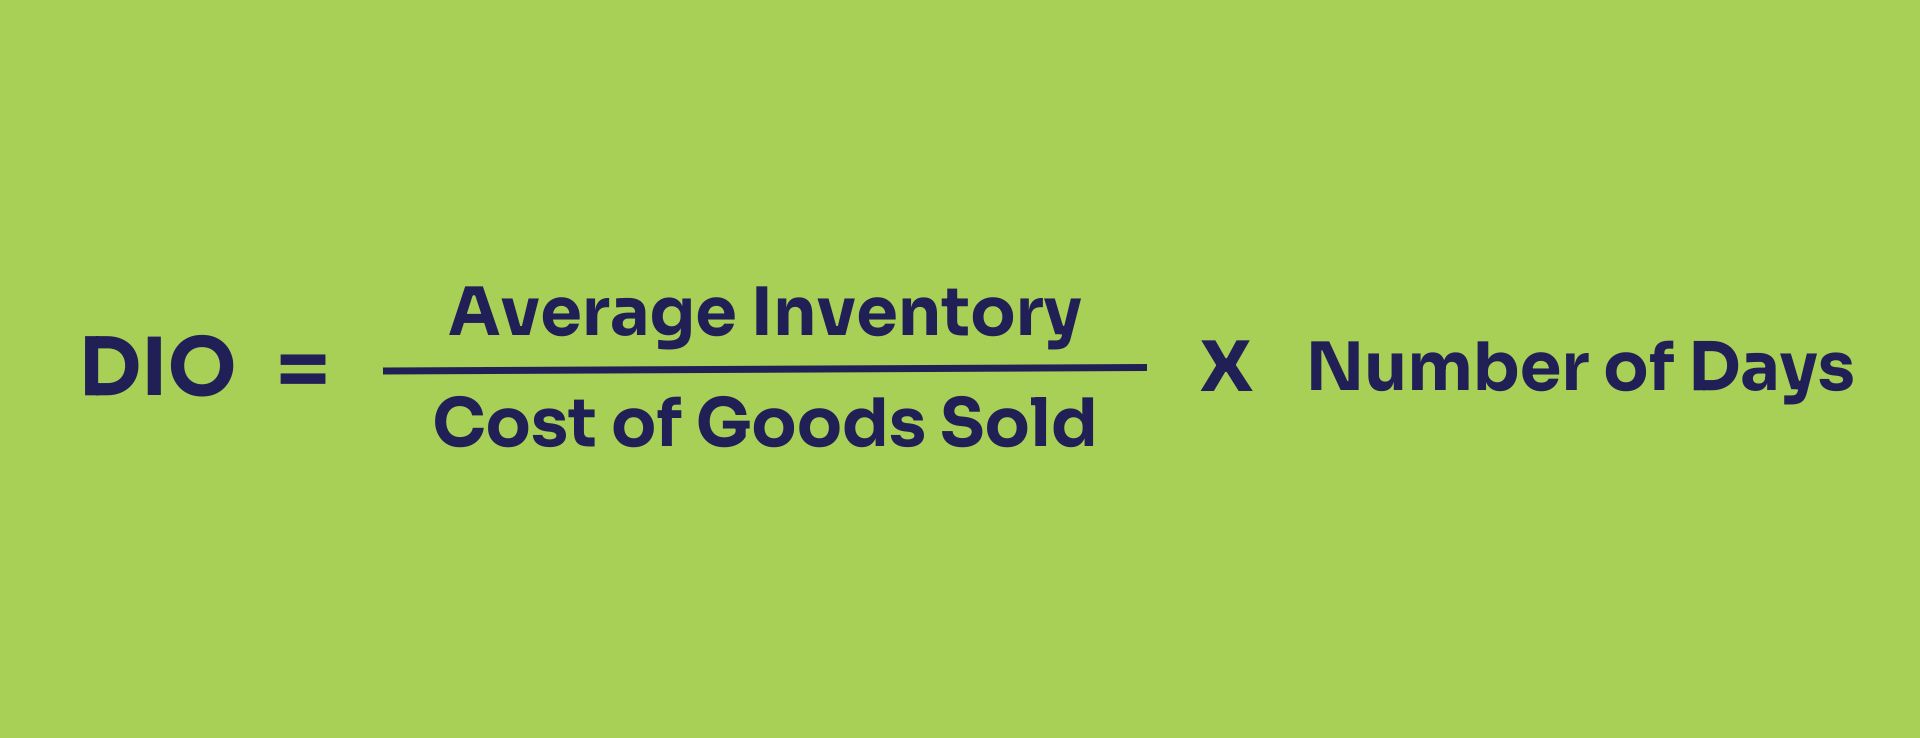
Let’s see what each of the components means:
- Average Inventory: This is the average value of inventory held over a specific period. It can be calculated by taking the sum of the beginning and ending inventory balances for the period and dividing by two.
- Cost of Goods Sold (COGS): This represents the direct costs attributable to the production of the goods sold by the company during the period. It includes expenses like raw materials, labour, and manufacturing overheads.
- Number of Days: This is the period over which you want to calculate the DIO, typically 365 days for a year. However, it can also be adjusted for shorter periods such as quarters or months.
By applying this formula, businesses can determine the average number of days their inventory sits before being sold, providing valuable insights into inventory management efficiency.
Steps to calculate DIO
- Determine Average Inventory
- To find the average inventory, add the beginning inventory and the ending inventory for the period and then divide by two. This can be found on the company’s balance sheet. For example: Average Inventory=Beginning Inventory+Ending Inventory / 2
- Identify the Cost of Goods Sold (COGS)
- Locate the COGS on the company’s income statement. This figure includes all direct costs of producing goods sold by the company during the period. COGS encompasses raw materials, labour, and manufacturing overheads directly tied to the production process.
- Select the time period
- Decide the period for which you are calculating DIO. The standard period is 365 days for a full year, but you can also calculate it for shorter periods like a quarter (90 days) or a month (30 days).
- Apply the DIO formula
- Using the values obtained, plug them into the DIO formula. For example, if the average inventory is $150,000 and the COGS is $900,000 over a year:
DIO = (150,000 / 900,000) × 365 = 60.83 days
- This means that, on average, the company holds its inventory for about 61 days before selling it.
Practical example
To illustrate how to calculate DIO, let’s go through a detailed hypothetical example. This example will help clarify the steps and the importance of each component in the calculation.
Example values:
- Beginning inventory: $200,000
- Ending inventory: $100,000
- Cost of Goods Sold (COGS): $1,200,000
- Number of days: 365 (for a full year)
Step-by-step calculation:
- Calculate average inventory: The first step is to determine the average inventory held over the period. Average inventory is calculated by taking the sum of the beginning and ending inventory balances for the period and then dividing by two. This gives a more accurate picture of the inventory levels throughout the year, smoothing out any fluctuations.


Do you find this article interesting?
Subscribe to our Newsletter for updates on the latest blog articles.
Average Inventory = (200,000 + 100,000) / 2 = 150,000
In this example, the average inventory for the year is $150,000.
- Apply the DIO formula: Next, we apply the DIO formula using the average inventory, COGS, and the number of days in the period. This formula helps us determine the average number of days the inventory is held before it is sold.
DIO = (Average Inventory / COGS) × Number of Days
Plugging in the values from our example:
DIO = (150,000 / 1,200,000) × 365 = 45.63 days
Interpretation: This calculation shows that, on average, the company holds its inventory for about 46 days before it is sold.
Interpreting DIO
High DIO
A high DIO indicates that a company takes a longer time to sell its inventory. While this might suggest that the company maintains a high level of stock to meet customer demand, it can also point to inefficiencies in inventory management.
Potential causes of high DIO:
- Overstocking: The company might be holding too much inventory relative to its sales. This could be due to poor demand forecasting, seasonal products, or bulk purchasing to obtain discounts.
- Slow-moving inventory: Products may not be selling as quickly as expected. This could be because of a lack of market demand, ineffective marketing strategies, or outdated inventory.
- Production delays: If production processes are slow or inefficient, inventory may build up before it can be sold.
Implications of high DIO:
- Increased holding costs: Higher inventory levels require more storage space, insurance, and maintenance, increasing overall costs.
- Cash flow issues: Capital tied up in unsold inventory could be used elsewhere in the business, such as for new investments or operational expenses.
- Risk of obsolescence: Products held for too long may become outdated or obsolete, leading to potential write-offs or discounts to clear old stock.
Low DIO
A low DIO suggests that a company sells its inventory quickly. This typically indicates efficient inventory management and strong sales performance, but it can also raise some concerns.
Potential causes of low DIO:
- High product turnover: Products may be in high demand, leading to quick sales and rapid turnover of inventory.
- Effective inventory management: The company may have optimised its inventory levels through accurate demand forecasting, efficient procurement processes, and effective sales strategies.
- Just-in-Time (JIT) inventory systems: Companies using JIT systems keep minimal inventory on hand, receiving goods only as they are needed for production or sales.
Implications of low DIO:
- Reduced holding costs: Lower inventory levels mean reduced costs for storage, insurance, and maintenance.
- Improved cash flow: Faster inventory turnover frees up cash that can be used for other business operations or investments.
- Risk of stockouts: If inventory levels are too low, the company might face stockouts, potentially leading to lost sales and customer dissatisfaction.
Using DIO to make informed business decisions
Regularly monitoring and analysing DIO can help businesses make strategic decisions to optimise inventory management and improve financial performance.
Identifying inefficiencies
Businesses can spot trends and find areas where inventory management can be improved by measuring DIO over time. For instance, it can be essential to reassess manufacturing plans, marketing tactics, or demand forecasting techniques if DIO is constantly high in order to increase sales.
Benchmarking against industry standards
Assessing DIO’s performance in comparison to its counterparts can be done by comparing it to industry benchmarks. This can help identify the advantages and disadvantages of inventory management procedures and establish reasonable goals for advancement.
Balancing inventory levels
Companies may combine having enough inventory to meet customer demand with lowering holding costs by using DIO information. This involves improving the accuracy of sales forecasts, streamlining procurement procedures, and optimising reorder points.
Enhancing cash flow management
Making informed decisions regarding investments and operating expenditures can benefit organisations by having a clear understanding of how inventory levels affect cash flow. Businesses can increase overall financial flexibility by freeing up money for other uses by lowering surplus inventory and increasing turnover rates.